
Spatial inertia and the racial stratification of housing wealth in post-Apartheid South Africa
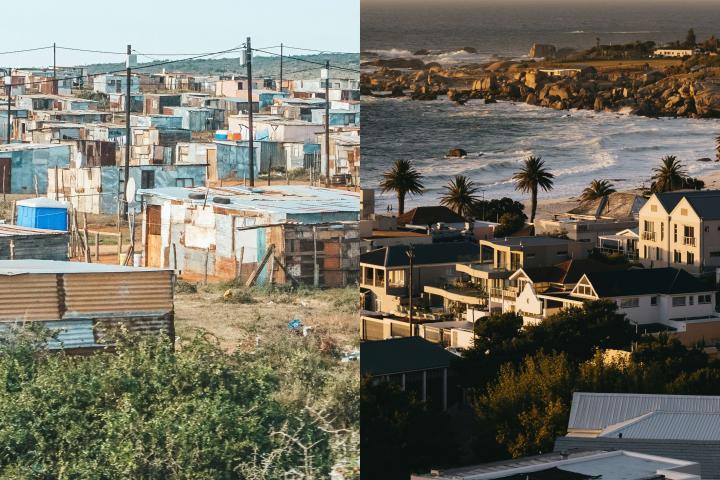
Image: Housing in an informal settlement and an upmarket suburb in Cape Town. Credit: Filiz Elaerts (left) and Timo Wielink (right) on Unsplash.
Background and Context
The spatial distribution of wealth inequality in South Africa today is an enduring legacy of its colonial and Apartheid past. Legislations such as the Natives Land Act of 1913 and the Group Areas Act of 1950 (along with its numerous amendments) systematically enforced an economic architecture that locked out Black South Africans from owning land and property, particularly in economically productive urban centres (Gardner & Graham, 2018; Maharaj, 2020; Turok, 2016). This exclusion moved generations of marginalised groups away from pathways that could have enabled capital accumulation and wealth creation, forcing them into entrenched poverty and persistent inequality (Marutlulle, 2022; Todes & Turok, 2018).
This historical context is crucial to understanding the low asset base held by marginalised groups in 1994 and the extreme concentration of wealth that defines the nation today. Recent estimates indicate that the top 10 percent of South Africans consistently held approximately 85 percent of total household wealth in the 1994-2018 period, with the top 1 percent share of wealth reaching 55 percent in 2017—one of the highest levels of wealth concentration globally (Chatterjee et al., 2022; World Inequality Database, n.d.). Our ongoing research on wealth inequality at the African Centre of Excellence for Inequality Research (ACEIR) seeks to develop a better understanding of the dynamics of wealth creation and accumulation, specifically trying to identify the gainers (and losers) in this complicated terrain.
Housing Wealth and its Expected Dynamics
As part of this research, we have focussed specifically on housing wealth, which is an important component of the average South African household’s wealth portfolio. Studies confirm that for the bottom 90 percent of the population, housing assets constitute between 40 and 65 percent of their total wealth (Chatterjee et al., 2022; Daniels & Augustine, 2016). This aligns with global evidence, underscoring the primacy of housing in a household’s wealth portfolio, and its importance in enabling accumulation of other asset types and for intergenerational mobility (Causa et al., 2019).
In real estate markets, a property’s location—with its implicit differences in access to infrastructure, services, and amenities—is a central feature of realising market value, echoing the adage of ‘location, location, location’. However, in South Africa, the legacies of spatial exclusion introduce further complexity into this process of wealth creation.
Anecdotal evidence across two houses with near-identical physical attributes presented a starting point for our analyses—the change in the absolute value of the house in a historically White neighbourhood over a ten-year period exceeded the change in the value of the house in a historically Indian neighbourhood over a fifty-year period by a factor of at least two.
While extant literature suggests that the barrier to entry into historically White suburbs is significantly higher, requiring more capital, either as debt or pre-existing wealth (Centre for Affordable Housing Finance, 2018; Lemanski, 2011; Frye, 2010), we hypothesised that housing assets witness scale-dependent returns, in line with Piketty’s theory of scale-dependent returns on capital (Piketty, 2014). Furthermore, given South Africa’s spatially segregated (urban) structures, we posited that scale-dependent returns on housing assets also bear a strong racial divide. Specifically, growth in home equity occurs at a much faster rate for those who own homes in affluent, well-located, predominantly White suburbs.
Our research, therefore, explores who has been able to realise the wealth-accumulating potential of housing assets in post-Apartheid South Africa, particularly focusing on whether ‘exiting’ Apartheid-era racially segregated spaces has had an observable effect on an individual’s real estate holdings.
Tracking Mobility and Wealth
The snapshots of our results presented below are built on data from Waves 1—5 of the National Income Dynamics Study (NIDS), which allowed us to track the same individuals over a ten-year period (2008-2017), observing changes in their residence and housing value over time.
Our meta-level tracking of individuals categorises residential areas based on their historical position within Apartheid group areas. These settlement types are:
- Tribal Authority Areas (TAA), corresponding to the former ‘homelands’ or Bantustans. They are overwhelmingly African, rural, and characterised by communal land tenure, and housed 27-32 percent of the NIDS sample.
- Urban Informal Areas (UIA), or informal settlements, typically on the urban periphery with insecure tenure. They are inhabited almost exclusively by African and Coloured communities and housed 8-9 percent of the sample.
- Rural Formal Areas (RFA), comprising of commercial farms; these are historically White-owned areas and account for 6-7 percent of the sample.
- Urban Formal Areas (UFA), the most economically desirable category, including cities, suburbs, and formal townships. It is the largest and most racially mixed (though internally segregated) category, with 45-47 percent of the sample.
Within our framework, ‘exiting’ a segregated space is defined as an individual moving from a TAA or UIA to an RFA or UFA.
This methodological choice is critical. A standard migration study might register a move from a township in Johannesburg (a UFA) to a township in Cape Town (also a UFA) as ‘migration’. Our study's meta-framework, however, would identify that this individual has not ‘exited’ their settlement type. This design is thus uniquely able to test whether South Africans are truly moving out of Apartheid-designated types of spaces or simply moving between them. It can also test whether moving out results in realising gains in housing assets.
To measure housing wealth consistently for both owners and renters, we used imputed rent as a proxy. This is a standard economic concept that estimates the value of the housing services a homeowner consumes—what they would pay to rent their own home on the open market (Ceriani et al., 2022; Eurostat, 2010). Higher-quality, better-located properties command higher imputed rents, making this metric suitable for tracking changes in the value of housing assets over the decade for all individuals.
Finding 1: A Geography of Statis
The first major finding is that, despite the constitutional promise of freedom of movement, post-Apartheid South Africa is characterised by a deep-seated ‘spatial inertia’.
Our analysis reveals exceptionally low rates of mobility across settlement types. The rate of migration out of erstwhile segregated spaces is marginal at best. The vast majority of people from marginalised race groups—over 90 percent—continue to live in the areas that were designated for their race groups under Apartheid.
This “stickiness” of Apartheid geography is visually demonstrated in Figure 1, which tracks mobility pathways over the decade. The thickest flows show individuals remaining in their original settlement type. Nearly 90 percent of UFA residents remained in a UFA, and crucially, an average of 94 percent of TAA residents stayed in a TAA. The ‘exit’ rate for those in UIA was also marginal. This suggests that for most South Africans, especially those in historically segregated areas, spatial mobility remains the exception, not the rule. The ‘stickiness’ of Apartheid-era geography acts as a powerful structural constraint, limiting access to opportunities and perpetuating cycles of poverty.
Figure 1 Flow of Individuals Across Settlement Types

Source: NIDS Waves 1-5; Authors’ analyses
Finding 2: Observed Changes in Housing Value
What happens to the small minority who do manage to ‘exit’ these segregated spaces?
Our analyses confirmed that ‘exiting’ is correlated with observable gains in housing wealth. However, this process of wealth creation is neither neutral nor equitable. The economic returns to spatial mobility are deeply and persistently stratified by race.
The first step in understanding this is to disaggregate the UFA. The data shows that UFAs are not one single, integrated market but a collection of racially and economically distinct sub-markets. Figure 2 reveals that the entity ‘UFA’ implies something different depending on the race of the inhabitant.
Figure 2 Average Imputed Rent by Population Groups and Settlement Types

Source: NIDS Waves 1-5; Authors’ analyses
In Wave 1 (2008), the average imputed rent for White-occupied dwellings in a UFA (ZAR 2,740) was nearly six times higher than that of African-occupied dwellings in the same settlement type (ZAR 461). By Wave 5 (2017), while both groups saw increases, the absolute gap had widened dramatically: average White imputed rent reached ZAR 9,424, while average African imputed rent was ZAR 1,627.
This stratification is not just static; it also defines the gains from moving. An analysis of the mobility pathways (Figure 3) shows that the very act of ‘exiting’ segregation yields racially differentiated returns.
Figure 3 Change in Imputed Rent over Pathways by Population Groups and Settlement Types

Source: NIDS Waves 1-5; Authors’ analyses
- UIAUFA: Coloured movers experienced a 3.1-fold increase in their imputed rent. In contrast, their African counterparts along the same pathway saw only a 1.6-fold increase.
- TAAUFA: Coloured movers realised a 2.8-fold increase, compared to a modest 1.9-fold increase for African movers.
Our findings suggest that ‘exiting segregation’ is not translating into ‘entering integration’. Instead, marginalised populations are being re-sorted into racially distinct segments of the formal market. African and Coloured movers are not accessing the high-value, historically White suburbs. They are instead being channelled into formal, lower-value townships, which, while an improvement, offer significantly lower wealth-accumulation potential.
Consider Figure 4, which presents a scatterplot of housing value at origin against the housing value at destination, with White individuals highlighted in red and individuals from marginalised groups in light blue. The size of the dots represents the percentage change in their housing assets. This visualisation depicts the market segments that individuals find themselves in:
- The bottom-left quadrant implies a growth from a low-value base to a low-value base.
- The top-right quadrant indicates movement from a high-value base to a high-value base.
Figure 4 Differences in Market Access

Source: NIDS Waves 1-5; Authors’ analyses
What immediately emerges is evidence of the distinct sections of the housing markets that different racial groups are operating in, with White individuals almost exclusively being located in the high-high segment.
Read together, these illustrative extracts from our research suggest that even when individuals achieve upward spatial mobility, the fundamental racial hierarchy of wealth is reproduced, not dismantled.
Concluding Remarks
Our study adds to the emergent evidence of wealth inequality in post-Apartheid South Africa. The constitutional promise of freedom of movement and the emphasis on rapid urbanisation as a catalyst for dismantling the country's entrenched racial geography appear not to have materialised for a majority of its marginalised citizens. The empirical evidence from a decade of longitudinal data reveals a nation characterised by spatial inertia.
Spatial integration policies, while necessary, do not appear to be sufficient to redress South Africa's deep-seated racial wealth divide (Department of Human Settlements, 2025). We find evidence that simply providing a house is not the same as providing a wealth-building asset. When that house is located in a ‘spatial trap’, it may provide shelter, but it does not provide a pathway out of poverty. It may, in fact, entrench inequality, locking its marginalised owners into the left tail of the wealth distribution while those who own property in well-located, high-opportunity areas see their wealth grow exponentially.
References
Causa, O., Woloszko, N., & Leite, D. 2019. Housing, Wealth Accumulation and Wealth Distribution: Evidence and Stylized facts. OECD Economics Department Working Papers, 15881588. https://doi.org/10.1787/86954c10-en
Centre for Affordable Housing Finance. 2018. Residential Property Markets in South Africa: Size, Activity and Performance in Cape Town Cities Support Programme. National Treasury, Republic of South Africa.
Ceriani, L., Olivieri, S., & Ranzani, M. 2022. Housing, imputed rent, and household welfare. The Journal of Economic Inequality. https://doi.org/10.1007/s10888-022-09545-7
Chatterjee, A., Czajka, L., & Gethin, A. 2022. Wealth Inequality in South Africa, 1993–2017. The World Bank Economic Review, 361, 19–36. https://doi.org/10.1093/wber/lhab012
Daniels, R. C., & Augustine, T. 2016. The Measurement and Distribution of Household Wealth in South Africa using the National Income Dynamics Study (NIDS) Wave 4. SALDRU Working Paper Series, 183.
Department of Human Settlements. 2025, January 31. White Paper for Human Settlements. Republic of South Africa. https://www.dhs.gov.za/sites/default/files/Reform%20Symposium/White%20Paper%20Gazetted%2031%20January%202025.pdf
Eurostat. 2010. The distributional impact of imputed rent in EU-SILC. European Commission Publications Office. https://data.europa.eu/doi/10.2785/56240
Frye, I. 2010. A Review of Housing Policy and Development in South Africa since 1994 Studies in Poverty and Inequality Institure. Socio-economic Rights Institute of South Africa.
Gardner, D., & Graham, N. 2018. South African Urbanisation Review: Analysis of the Human Settlement Programme and Subsidy Instruments. The World Bank Group.
Lemanski, C. 2011. Moving up the Ladder or Stuck on the Bottom Rung? Homeownership as a Solution to Poverty in Urban South Africa: Homeownership as a solution to poverty in South Africa? International Journal of Urban and Regional Research, 351, 57–77. https://doi.org/10.1111/j.1468-2427.2010.00945.x
Maharaj, B. 2020. The Apartheid City. In R. Massey & A. GunterEds, Urban Geography in South Africa pp. 39–54. Springer International Publishing. https://doi.org/10.1007/978-3-030-25369-1_3
Marutlulle, N. K. 2022. Critical analysis of the role played by apartheid in the present housing delivery challenges encountered in South Africa. Africa’s Public Service Delivery and Performance Review, 101. https://doi.org/10.4102/apsdpr.v10i1.373
Piketty, T. 2014. Capital in the Twenty-First Century A. Goldhammer, Trans. Harvard University Press.
Todes, A., & Turok, I. 2018. Spatial Inequalities and Policies in South Africa: Place-based or People-centred? Progress in Planning, 123, 1–31. https://doi.org/10.1016/j.progress.2017.03.001
Turok, I. 2016. South Africa’s new urban agenda: Transformation or compensation? Local Economy, 311–2, 9–27.
World Inequality Database. n.d. [Data set]. WID.World