
Is Multidimensional Poverty being measured correctly?
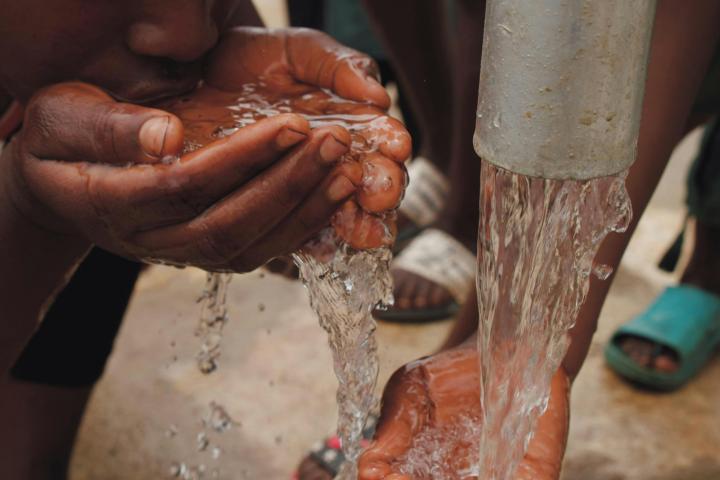
Image: Access to water is often a key indicator in multidimensional poverty indices. Credit: Kelly on Pexels.
This article highlights research being done within the African Centre of Excellence for Inequality Research which interrogates measurement issues in multidimensional poverty frameworks in African countries. Such multidimensional poverty measurement is being used to inform policy and resource allocation in poverty alleviation, and to assess performance in achieving the SDGs and other development goals. This makes it crucial to ensure that measured levels and trends of multidimensional poverty accurately reflect each country’s poverty situation. In this article we draw on work that we have done in Kenya and South Africa, highlighting the similarities, differences, and points of departure in the measurement issues and solutions proposed in these two countries.
Are We Measuring Multidimensional Poverty Correctly?
In most countries poverty is measured in both monetary and non-monetary terms. The Alkire-Foster (AF) framework is a deprivation-based measure of non-monetary poverty that is used globally in the measurement of multidimensional poverty. The most well-known example of this approach is the global MPI model which consists of 3 dimensions, namely health, education, and living standards. This model is applied across countries to allow for consistency in international comparisons of the levels and trends of multidimensional poverty over time. Based on a 2024 report, 112 countries worldwide were reporting global multidimensional poverty index (MPI) statistics, i.e. poverty headcount, poverty intensity, and the multidimensional poverty index.
The global MPI and SAMPI as measures of non-monetary poverty are only as good as the quality of the poverty indicators, datasets and measures used. This is especially important since misrepresentation of the deprivations masks the true extent of multidimensional poverty, potentially leading to a misdirection of any interventions required to reduce these deprivations. Building on prior research and training that ACEIR has been involved in with the University of Bristol and other partners, we undertook a statistical assessment of the MPI frameworks to assess the reliability and validity of the models used in both countries, i.e. the SAMPI in South Africa and the global MPI in both Kenya and South Africa. Reliability measures how well the individual indicators distinguish between the poor and the non-poor (discrimination) and whether an adequate number of individuals are deprived in each indicator (difficulty). Such an assessment ensures that the overall poverty model has sufficient variance in the number of deprivations across individuals. More formally, overall model reliability is measured using the McDonald Omega statistic with a threshold of at least 0.8. The individual indicator reliability is measured using an item response theory test with a threshold of at least 0.4 for the discrimination statistic and a difficulty statistic of between -3 and +3.
As shown in Table 1 below, the SAMPI meets overall model reliability thresholds. However, for both the SAMPI and the global MPI models (of both countries), some of the indicators do not meet the reliability thresholds. This is especially so for the South Africa global MPI model, where 5 out of the possible 10 indicators fail the requirement of having a sufficient proportion of individuals being deprived. This is a positive result from a development perspective since it implies that South Africa has made significant strides in reducing deprivation in these indicators. However, as a measure of poverty, these indicators are not reliable. An interesting point to note is that unemployment does not meet the difficulty threshold in the SAMPI model, both in 2001 and 2011. This is an interesting scenario since unemployment is widely accepted as one of the most persistent problems in South Africa. The distribution of deprivation in the employment dimension is skewed, occurring mainly in households experiencing multiple deprivations in other indicators. As a result, the probability of being deprived in employment only exceeds 50% at the top end of the deprivation distribution (at 9 or more out of the 11 indicators in the SAMPI), which causes the reliability test to fail.
Table 1: Reliability statistics for SAMPI and global MPI models in South Africa and Kenya
|
|
|
SOUTH AFRICA |
|
KENYA |
||||||
|
|
SAMPI 2001 |
SAMPI 2011 |
DHS 2016 |
DHS 2014 |
DHS 2022 |
|||||
|
McDonald Omega |
0.83 |
0.80 |
0.71 |
0.69 |
0.76 |
|||||
|
|
Disc. |
Diff. |
Disc. |
Diff. |
Disc. |
Diff. |
Disc. |
Diff. |
Disc. |
Diff |
|
Child mortality |
0.57 |
8.98 |
0.49 |
15.79 |
0.60 |
6.44 |
0.27 |
12.04 |
0.31 |
11.55 |
|
Nutrition |
|
|
|
0.30 |
4.17 |
0.66 |
1.87 |
0.77 |
2.07 |
|
|
Years of schooling |
0.64 |
5.15 |
0.32 |
11.11 |
0.48 |
9.47 |
1.85 |
1.40 |
1.95 |
1.66 |
|
School attendance |
1.06 |
1.74 |
0.87 |
3.01 |
0.78 |
4.37 |
1.44 |
2.00 |
1.57 |
1.79 |
|
Electricity |
|
|
|
4.49 |
1.33 |
4.55 |
-0.85 |
3.01 |
-0.14 |
|
|
Fuel for lighting |
4.56 |
0.63 |
4.90 |
1.15 |
|
|
|
|||
|
Fuel for heating |
7.26 |
0.03 |
2.40 |
0.29 |
|
|
|
|||
|
Fuel for cooking |
8.74 |
0.12 |
4.98 |
0.73 |
1.54 |
1.11 |
2.60 |
-1.69 |
2.79 |
1.15 |
|
Water access |
3.08 |
0.03 |
3.27 |
0.17 |
1.62 |
1.40 |
1.26 |
-0.18 |
1.28 |
0.16 |
|
Sanitation |
2.65 |
0.33 |
2.98 |
0.65 |
0.42 |
3.81 |
0.86 |
-1.56 |
0.92 |
-0.68 |
|
Improved housing |
|
|
|
1.49 |
1.48 |
2.65 |
-2.53 |
2.11 |
0.22 |
|
|
Dwelling type |
1.88 |
0.73 |
1.66 |
1.15 |
|
|
|
|||
|
Asset ownership |
2.01 |
0.55 |
1.90 |
1.67 |
2.84 |
1.51 |
1.65 |
0.62 |
1.57 |
0.85 |
|
Unemployment |
0.57 |
3.38 |
0.37 |
6.17 |
|
|
|
|
|
|
Note: The cells highlighted in red show the indicators that do not meet the required reliability thresholds.
Validity measures ensure that the dimensions and weights used in the models result in a good measure of multidimensional poverty. Formally, confirmatory factor analysis (CFA) assesses the relationships between the indicators used and the phenomenon they are supposed to measure - in this case, multidimensional poverty. CFA produces goodness-of-fit statistics. We use two such statistics, the Comparative Fit Index (CFI) and the Tucker Lewis Index (TLI), both of which test the model against a baseline model with no correlated indicators. They both have a minimum threshold of 0.9.
Table 2: Validity statistics for SAMPI and global MPI models in South Africa and Kenya
|
|
SOUTH AFRICA |
KENYA |
|||
|
|
SAMPI 2001 |
SAMPI 2011 |
DHS 2016 |
DHS 2014 |
DHS 2022 |
|
CFI |
0.57 |
0.57 |
0.43 |
0.89 |
0.92 |
|
TLI |
0.55 |
0.55 |
0.4 |
0.89 |
0.91 |
To address these validity and reliability issues, we start by dropping the unreliable indicators from the models. Then, to the extent that the datasets allow, we add other context-appropriate indicators drawing on the extensive international literature.
Clearly there is no one-size-fits-all solution for developing a robust country MPI model. Rather, it is a context-specific exercise. The fact that the global MPI does not pass rigorous assessment in either country raises serious questions about the accuracy and usefulness of these influential global metrics of countries’ progress in addressing multidimensional poverty. Obtaining better measures requires careful country-level work. While dropping unreliable indicators and adding a few relevant indicators worked in the Kenyan context, this was not a satisfactory solution in South Africa. Clearly, there is a need to improve on the SAMPI, and this requires a systematic research programme that interrogates available datasets, indicators and deprivation cut-offs. It would be optimal to undertake such an exercise with those in Statistics South Africa and others responsible for the SAMPI and to ground this work within the national poverty policy agenda. ACEIR aspires to do such work across the continent, with Kenya and South Africa serving as test cases for the value of such research.
References
[1] S. Kamundia and M. Leibbrandt, ‘Measuring Multidimensional Poverty in Kenya Across Time and Space’, Cape Town, ACEIR working paper 14, Aug. 2025. Available:https://aceir.uct.ac.za/articles/2025-08-21-measuring-multidimensional-poverty-kenya-across-time-and-space
[2] S. Kamundia and M. Leibbrandt, ‘A Psychometric Assessment of the Multidimensional Poverty Frameworks in South Africa (Forthcoming ACEIR/SALDRU working paper)’, Cape Town, 2025.
[3] Oxford Poverty & Human Development Initiative and United Nations Development Programme, ‘Global Multidimensional Poverty Index 2024: Poverty amid conflict’, 2024.
[4] Statistics South Africa, ‘The South African MPI: Creating a multidimensional poverty index using census data’, 2014.
[5] Oxford Poverty and Human Development Initiative, ‘National MPI Directory’. Available: https://ophi.org.uk/national-mpi-directory
[6] H. E. Nájera Catalán and D. Gordon, ‘The Importance of Reliability and Construct Validity in Multidimensional Poverty Measurement: An Illustration Using the Multidimensional Poverty Index for Latin America (MPI-LA)’, J Dev Stud, vol. 56, no. 9, pp. 1763–1783, Sep. 2020, doi: 10.1080/00220388.2019.1663176.
[7] H. E. Nájera Catalán, ‘Reliability, Population Classification and Weighting in Multidimensional Poverty Measurement: A Monte Carlo Study’, Soc Indic Res, vol. 142, no. 3, pp. 887–910, Apr. 2019, doi: 10.1007/s11205-018-1950-z.
[8] African Centre of Excellence for Inequality Research, ‘Advanced poverty research methods course’. Available: https://aceir.uct.ac.za/capacity-building/short-courses/advanced-poverty-research-methods-course
[9] S. Jackson and D. Yu, ‘Re-examining the Multidimensional Poverty Index of South Africa’, Soc Indic Res, vol. 166, no. 1, pp. 1–25, Feb. 2023, doi: 10.1007/s11205-023-03062-4.
[10] M. E. Santos, P. Villatoro, X. Mancero, and P. Gerstenfeld, ‘A Multidimensional Poverty Index for Latin America’, 79, 2015. Available: http://www.ophi.org.uk
[11] Parliamentary Budget Office and Multidimensional Poverty Peer Network, ‘Roundtable Discussion on Multidimensional Poverty’, 2024. Available: https://ophi.org.uk/event/mppn-roundtable-discussion-cape-town